
Research Center
ALICE In Focus Series
Financial Hardship Among People With Disabilities
Longstanding discriminatory policies and practices that impact access to education, employment, health care, housing and other resources create barriers to financial stability for people with disabilities. This fact hits home for the more than 40 million people in the U.S. who have a cognitive, hearing, vision, or ambulatory disability, or one that makes self-care or independent living difficult.
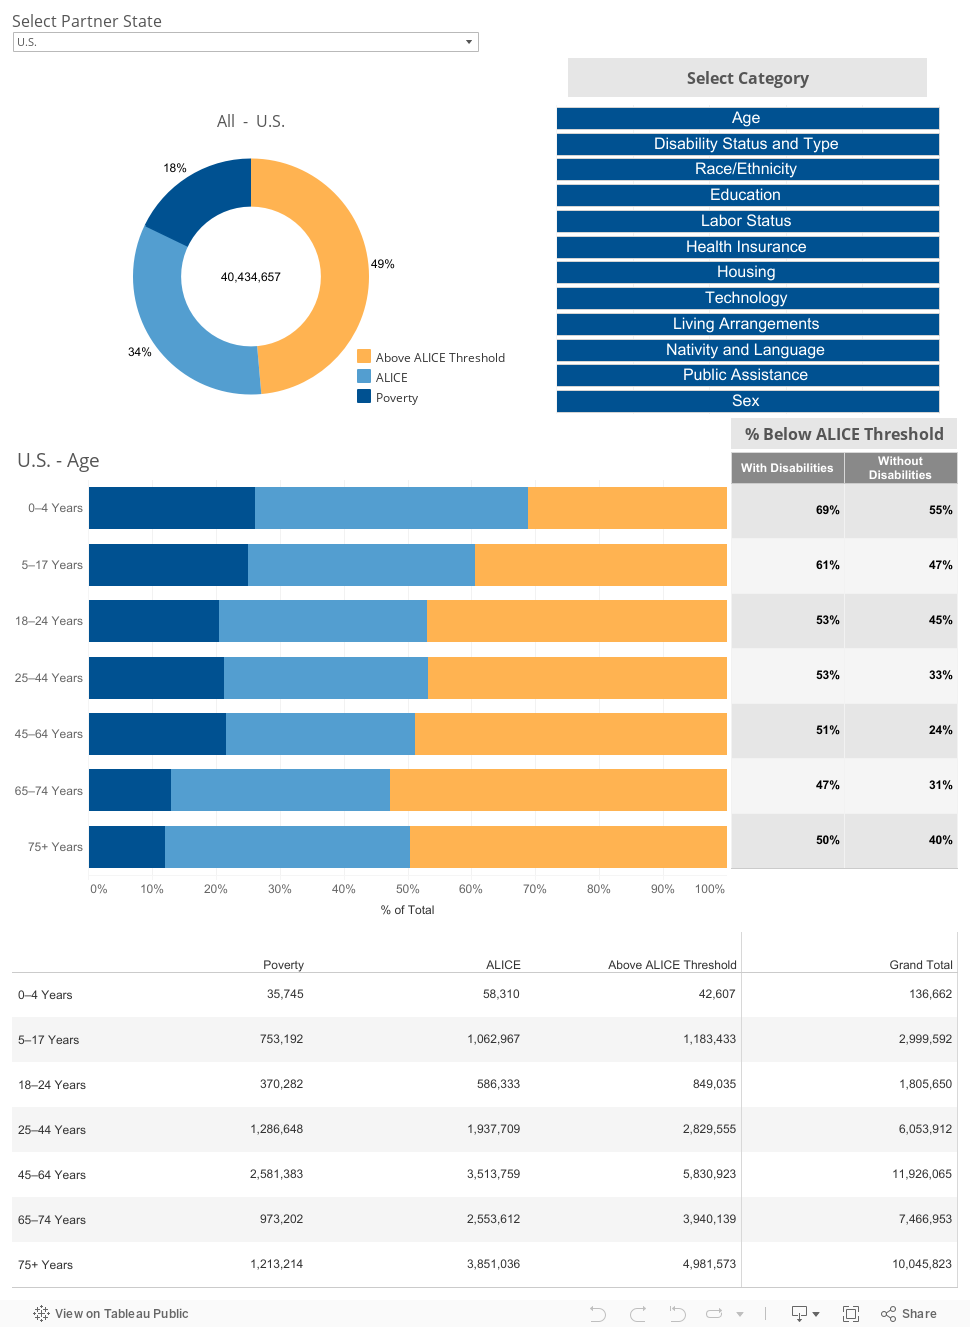
According to the outdated Federal Poverty Level, 18% of people with disabilities in the U.S. lived in poverty in 2019. Yet United For ALICE data shows that another 34% were also struggling, in households that earned above the FPL but less than what it costs to afford the basics. These households are ALICE: Asset Limited, Income Constrained, Employed.
Between families in poverty and those who are ALICE, more than half of all people with disabilities in the U.S. lived in a household with income below the ALICE Threshold, struggling to afford essentials in the communities where they lived.
The tabs below offer a more detailed view of people with disabilities who are experiencing financial hardship.

ALICE Disability Data Dashboard
The ALICE Disability Data Dashboard puts the data about people with disabilities who are experiencing financial hardship at your fingertips. The Dashboard shows the number and percentage of people with disabilities in 2019 who lived in households with:
- Income below the Federal Poverty Level (Poverty)
- Income above the Federal Poverty Level but below what is needed to afford the cost of basic expenses (ALICE)
- Income above the cost of basics (Above ALICE Threshold)
People with disabilities below the ALICE Threshold include both those in poverty and those in ALICE households.
With the first Dashboard tool, you can explore the data on people with disabilities by category, including age, race/ethnicity, nativity, disability status, living arrangements, and other parameters.
How to Use This Tool
- Select an ALICE Partner State or select 'U.S.' to see national data
- Select a Category (like Age, Race/Ethnicity, or Disability Status)
- Hover over the bar graph to see the number and percentage of people with disabilities in each group
- View the table below the bars to see the number of people with disabilities in each group
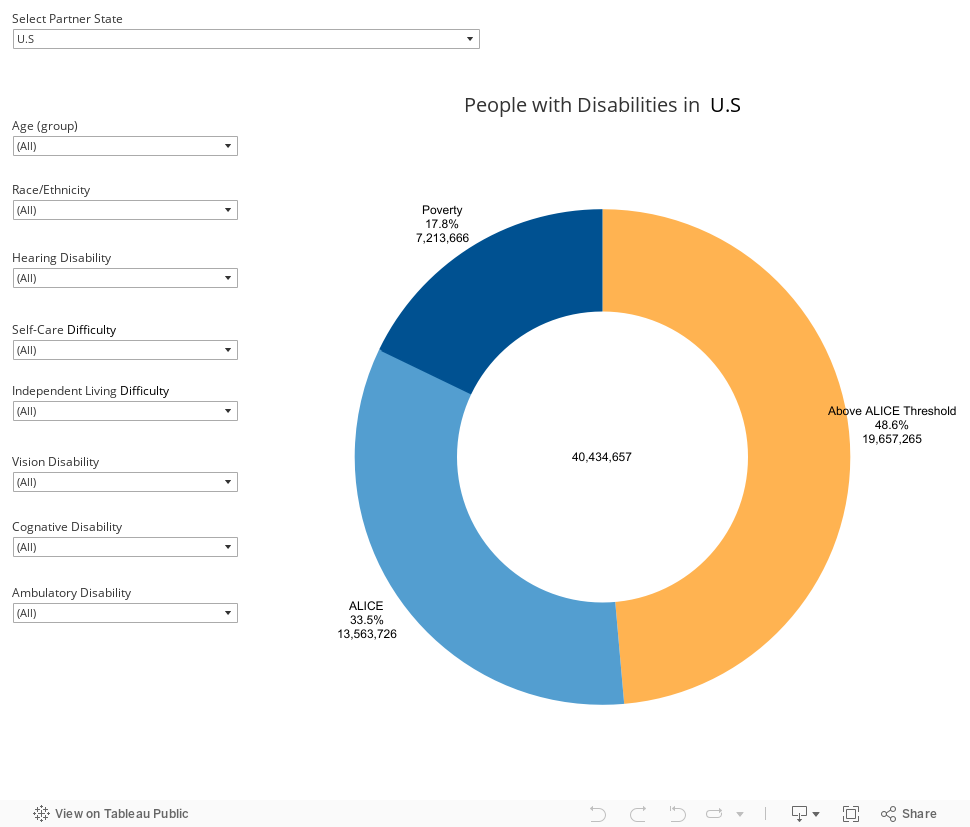
How to Use This Tool
- Select an ALICE Partner State or select 'U.S.' to see national data
- Use the drop-down menus to select variables across different categories (like “Cognitive Disability,” “Age 5–17,” and “Black”)
- The pie chart will change based on your selections to show the percentage and number of people with disabilities in the selected groups who are in poverty-level, ALICE, or Above ALICE Threshold households
- When “all” is selected, it means that all people with disabilities for that variable are included. For example, when “all” is selected for “Cognitive Disability,” the pie chart includes people with disabilities who have a cognitive disability and people with disabilities who do not have a cognitive disability (meaning they have some other type of disability).
- To see data for people who have only one type of disability, select “no” for the other types of disability. For example, to see data for people with a cognitive disability alone, select “Cognitive Disability” and “no” for Hearing Disability, Self-Care Difficulty, Independent Living Difficulty, Vision Disability, Cognitive Disability, and Ambulatory Disability.
Defining Disability
The ALICE in Focus Research defines “people with disabilities” as those who reported in the 2019 U.S. Census Bureau’s American Community Survey (ACS) having an ambulatory disability, a cognitive disability, a hearing or vision disability, or a disability that makes self-care or independent living difficult.
- Ambulatory: Does this person have serious difficulty walking or climbing stairs? (Age 5+ only)
- Cognitive: Because of a physical, mental, or emotional condition, does this person have serious difficulty concentrating, remembering, or making decisions? (Age 5+ only)
- Independent Living: Because of a physical, mental, or emotional condition, does this person have difficulty doing errands alone such as visiting a doctor’s office or shopping? (Age 15+ only)
- Hearing: Is this person deaf or does he/she have serious difficulty hearing? (All ages)
- Self-Care: Does this person have difficulty dressing or bathing? (Age 5+ only)
- Vision: Is this person blind or does he/she have serious difficulty seeing even when wearing glasses? (All ages)
Because ALICE status is determined by household income and composition, this dataset does not include people experiencing homelessness, who are not counted in the American Community Survey, nor people living in Census-defined “group quarters”: institutional group quarters (such as nursing homes or correctional facilities) or non-institutional group quarters (such as group homes, college dormitories, or military barracks).
Technical Details
- Sources: ALICE Threshold, 2019; U.S. Census Bureau, American Community Survey, PUMS, 2019 (latest available as of publication date).
- Rounding: Percentages in the ALICE Disability Data Dashboard may differ +/- 1% from percentages included in the state and national Research Briefs due to rounding. Total numbers are presented in the Dashboard for calculation.
- Race/Ethnicity: All racial categories except Two or More Races are for one race alone, non-Hispanic. The Hispanic group may include households of any race.
- Sex: Sex includes the sex reported by the respondent for household members; the ACS only includes the options “male” or “female”.
- Work Status: The Work category includes only people ages 18–64.
- Selected Variables: All variables in this Dashboard come from the American Community Survey. To see how these variables are defined and named in this Dashboard, download the DATA DICTIONARY
- Missing Data and Grand Totals:Any group with fewer than 200 people with disabilities is suppressed (not shown) to maintain accuracy and confidentiality. Grand totals exclude any sub-populations that are too small to display (sums in columns).