
Research Center
ALICE In Focus Series
Children in Financial Hardship
According to the outdated Federal Poverty Level, 16% of children in the U.S. lived in poverty in 2022. Yet United For ALICE data shows that another 34% — more than twice as many — were also growing up in hardship, in households that earned above the poverty level but less than what it costs to afford the basics. These households are ALICE: Asset Limited, Income Constrained, Employed.
The reality is that between families in poverty and those that are ALICE, half (50%) of children in the U.S. in 2022 lived in households with income below the ALICE Threshold, struggling to afford the basics of housing, child care, food, transportation, health care, technology, and taxes in their communities.
Use the Data Dashboard, Local Maps, State Briefs & Sponsors, Committees, and Resources tabs below to learn more about children experiencing financial hardship.

ALICE Children Data Dashboard
The ALICE Children Data Dashboard puts the data about children and hardship at your fingertips. The Dashboard shows the number and percentage of children in 2019 and 2022 who lived in households with:
- Income below the Federal Poverty Level (Poverty)
- Income above the Federal Poverty Level but below what is needed to afford the cost of basic expenses (ALICE)
- Income above the cost of basics (Above ALICE Threshold)
Children below the ALICE Threshold include both those in poverty and those in ALICE households.
The Data Dashboard includes two tools:
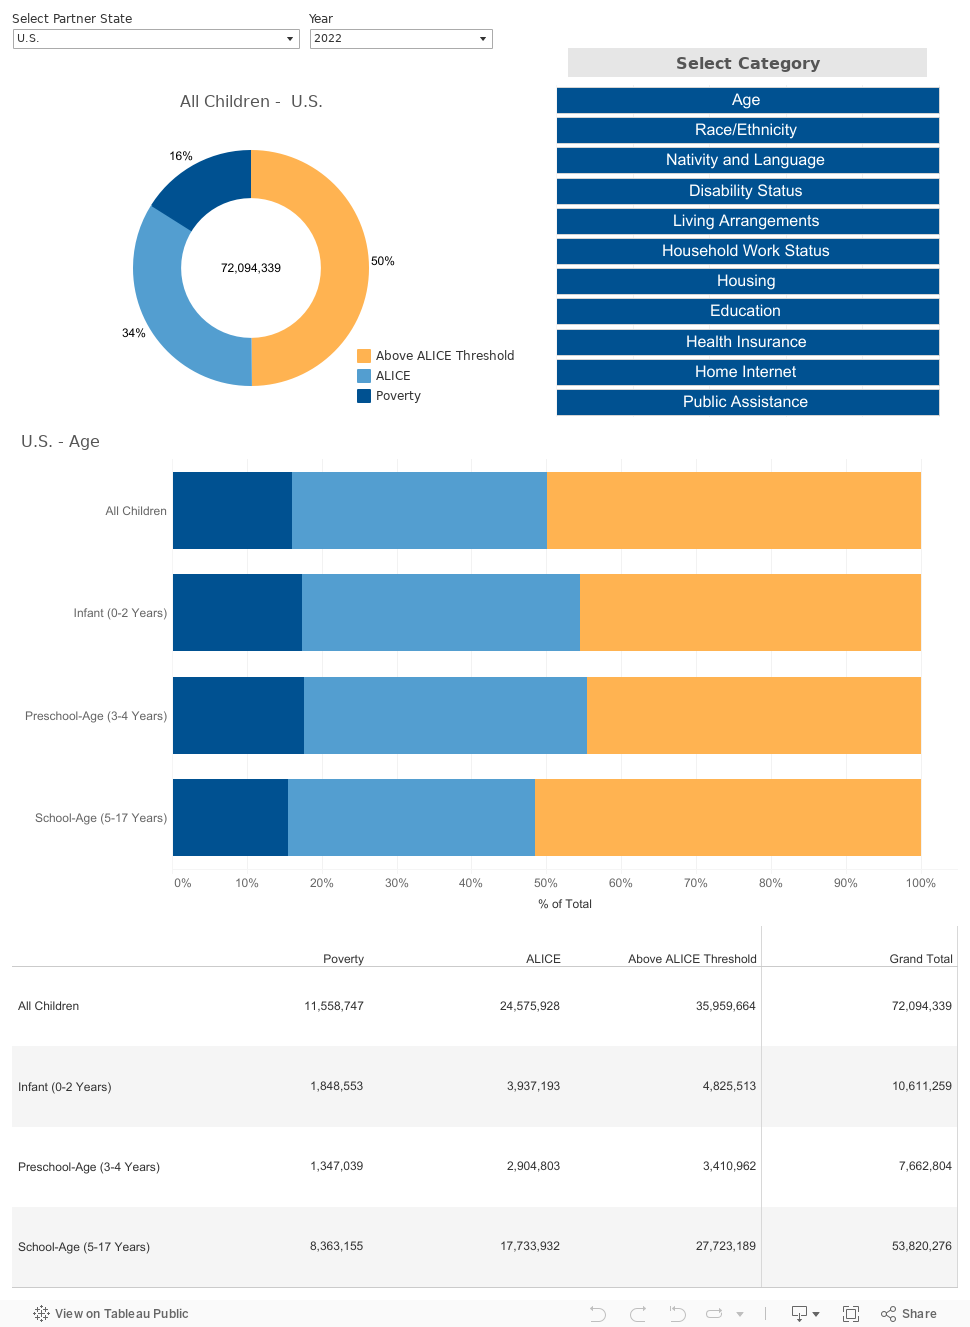
Tool 1 - Hardship by Category: Explore the data on children in financial hardship by a single category, such as age, race/ethnicity, nativity and language, disability status, living arrangements, and other parameters.
How to Use This Tool
- Select an ALICE Partner State or "U.S." to see national data
- Select a year (2019 or 2022)
- Select a Category (like Age, Race/Ethnicity, or Disability Status)
- Hover over the bar graph to see the number and percentage of children in each group
- View the table below the bars to see the number of children in each group
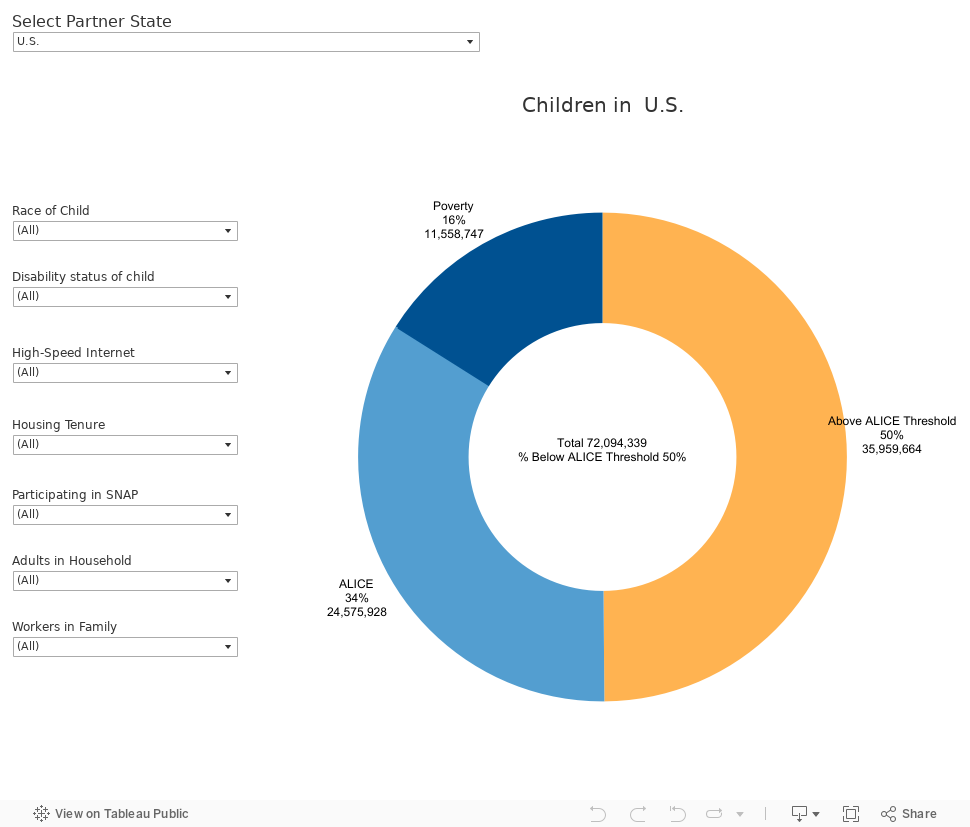
Tool 2 - Intersectional Hardship: Combine intersecting categories that affect hardship (such as children who live in renter households, are Hispanic, and have a disability).
How to Use This Tool
- Select an ALICE Partner State or "U.S." to see national data
- Use the drop-down menus to select variables across different categories (for instance, "Hispanic", "Child With a Disability”, and “Renter Household”)
- The pie chart will change based on your selections to show the percentage and number of children in poverty-level, ALICE, or Above ALICE Threshold households
Technical Details
- Sources: ALICE Threshold, 2019 and 2022; U.S. Census Bureau, American Community Survey, PUMS, 2019 and 2022.
- Rounding: Percentages in the ALICE Children Data Dashboard may differ +/- 1% from percentages included in the state and national Research Briefs due to rounding. Total numbers are presented in the dashboard for calculation.
- Race/Ethnicity: All racial categories except Two or More Races are for one race alone, non-Hispanic. The Hispanic group may include households of any race.
- Selected Variables: All variables in this dashboard come from the American Community Survey. To see how these variables are defined and named in this dashboard, download the DATA DICTIONARY
- Missing Data and Grand Totals: Any group with 500 or fewer children is suppressed (not shown) to maintain accuracy and confidentiality. Grand totals exclude any sub-populations that are too small to display (sums in column).