
ALICE ECONOMIC VIABILITY DASHBOARD
Measuring Economic Well-Being for ALICE
The ALICE Economic Viability Dashboard reveals the economic and community conditions of people who are struggling financially — those below the ALICE Threshold. This includes people in households with income below the Federal Poverty Level (FPL) and those who are ALICE (Asset Limited, Income Constrained, Employed), with income above the FPL but below the cost of basics.
By studying ALICE households as well as those in poverty, United For ALICE research shows the true extent of financial hardship across the country. The ALICE Economic Viability Dashboard builds on this research, exploring why so many households are struggling, with new data on ALICE work, housing, and community resources.
Hover/click on the elements below to learn more:
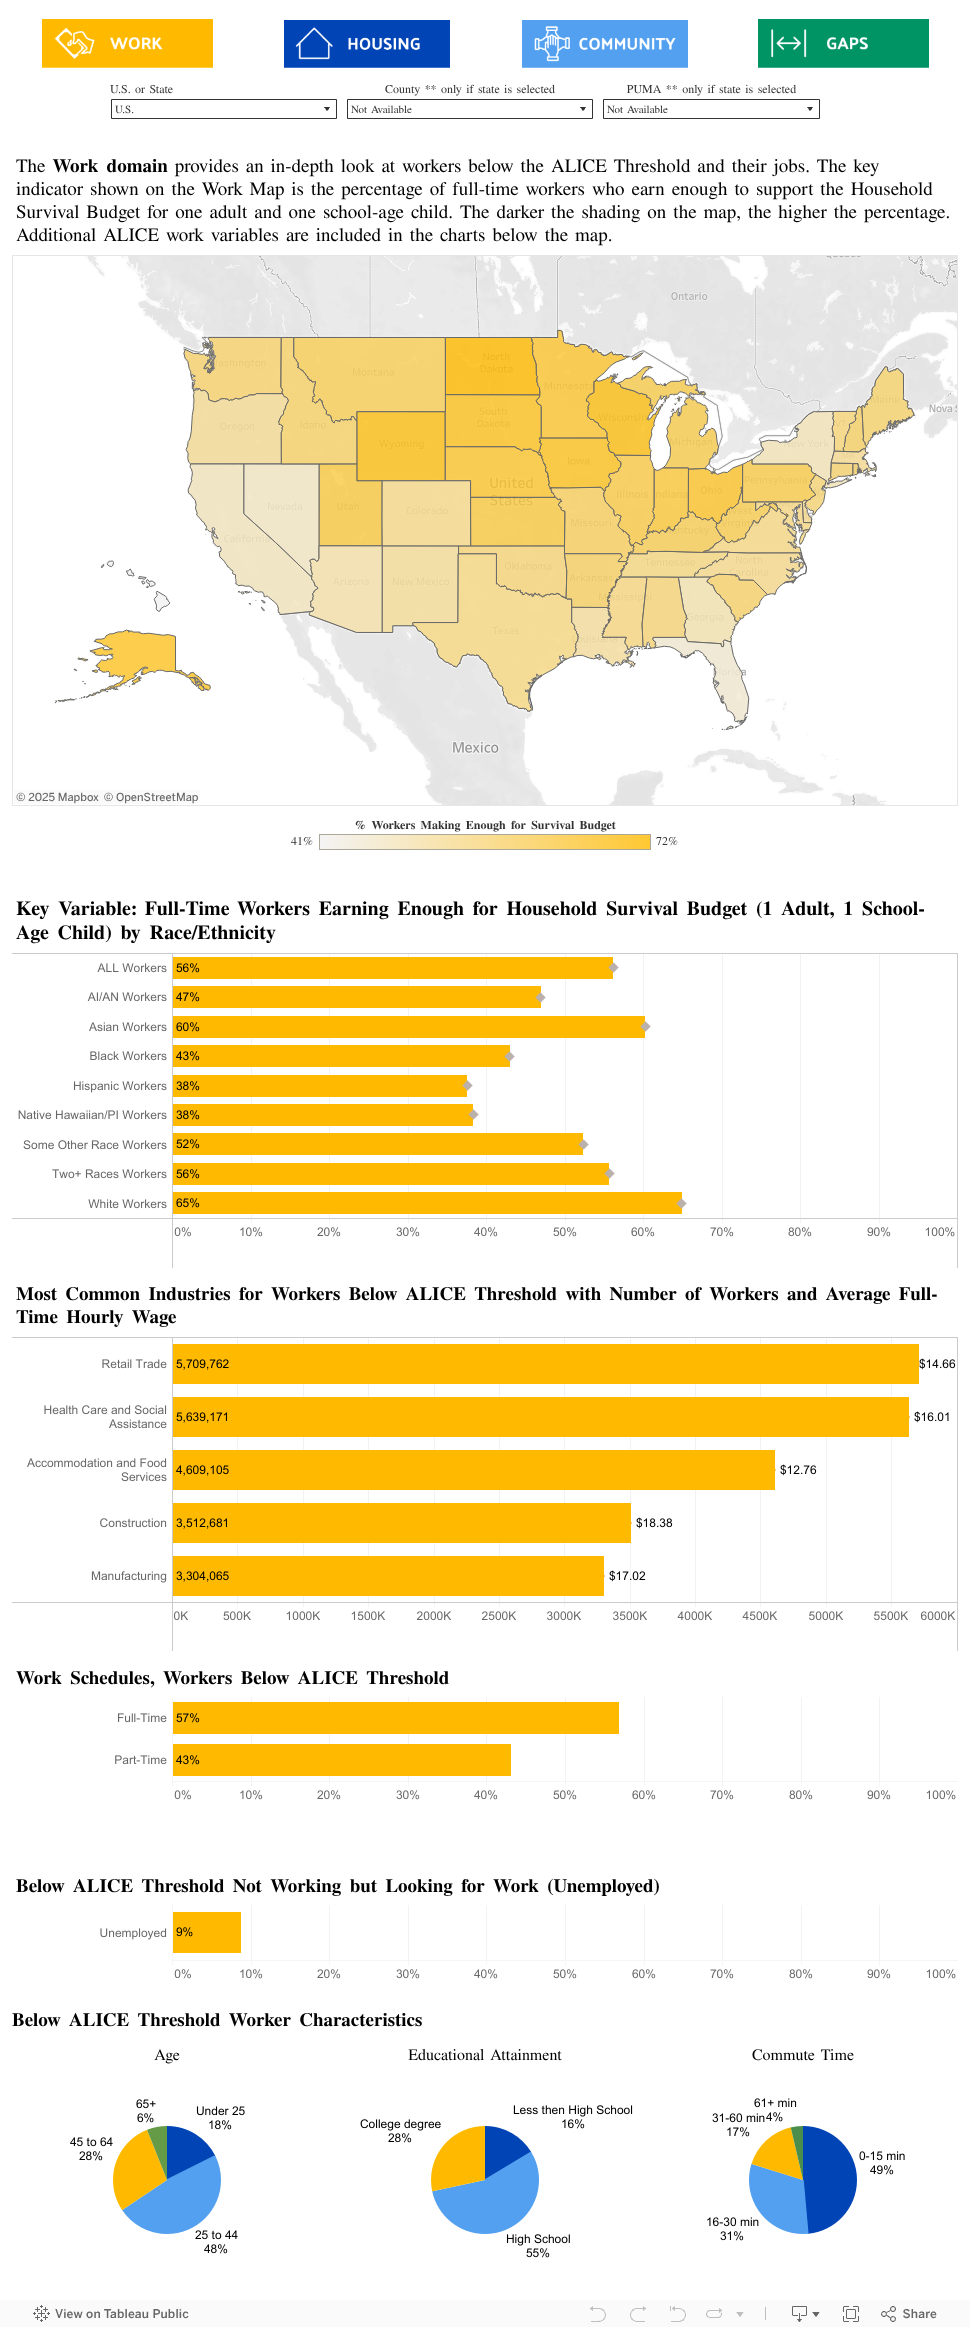
Work
Explore the percentage of full-time workers below the ALICE Threshold who earn enough to afford the Household Survival Budget (1 adult and 1 school-age child) and gain deeper understanding of ALICE workers in the state and local labor force. Variables include:
- Workers below the ALICE Threshold and their wages, demographics, common industries, educational attainment, and commute time
- People below the ALICE Threshold who are out of the labor force and their characteristics
Housing
See the percentage of households below the ALICE Threshold in affordable housing, along with other key variables, including the percentage of households below the Threshold who…
- Own their home
- Are rent or owner cost burdened
- Are renting yet paying more than median owner costs
Community
Better understand the supports that communities provide to help ALICE meet basic needs, including…
- Preschool enrollment
- High-speed internet
- Commute time
- Health insurance
- Grocery store access
Gaps
Use the Gap Map and index scores to see and compare community performance on each domain (Work, Housing, Community).
What can users do with this dashboard?
- Explore data on work, housing, and community resources for households below the ALICE Threshold by location and race/ethnicity
- Compare any two locations on key ALICE work, housing, and community conditions
- Create action plans to remove barriers, fill gaps, and make structural changes needed to improve conditions for workers and households in your state or local community
What is unique about this dashboard?
- It focuses specifically on workers and households that are unable to afford the basics based on income and local cost of living
- It combines economic and equity perspectives
- It offers actionable data and best practices to address gaps across states and local communities
Who is this dashboard for?
- Community planners, engineers, builders, real estate developers, zoning experts, and housing advocates
- Local, state, and federal policymakers
- Chambers of commerce and economic development agencies
- United Ways and other key community nonprofit organizations
- Advocates working for equity in education, food, transportation, health care, and technology
The ALICE Economic Viability Dashboard includes four map views — Work, Housing, Community, and Gap Map — and related variables for each view.
The data source is the U.S. Census Bureau’s Public Use Microdata Sample (PUMS, 2023). Geographies included in this dataset are U.S., State, and Public Use Microdata Areas (PUMAs).
How do I use this dashboard?
- Pick a map view: Click on the boxes below to select from Work, Housing, Community, or Gap Map view. As you move from one map view to another, the location you selected in the first view will remain selected until you change the geography.
- Select/change geographies: The maps on this page default to the national view, which shows all states on the map and national averages in the charts below the map. From this view, you can click a single state on the map to see state average data in the charts, or ‘CTRL + Click’ to select multiple states and see regional averages in the charts. To see data below the state level, use the ‘U.S. or State’ drop-down menu to first select a state, then use the ‘County’ and/or ‘PUMA’ drop-down menus to select a county and/or one or more PUMAs. From this view, click a PUMA on the map or use the ‘PUMA’ drop down menu to see data for that geography in the charts. To select multiple PUMAs, ‘CTRL + Click’ on the map.
- Navigate the map: Hover your mouse over the map and a toolbar will appear in the upper left-hand corner. Use the + and – signs to zoom in and out. Select the house icon to re-center the map view on your selected geography. Use the additional tools to pan or use a selector tool.
- View additional details: Hover your mouse over locations on the map and chart elements (bars, pie charts) to see additional details.
- Remove or reset filters: To remove a filter, hover over the drop-down menu you would like to clear (e.g., State, County, PUMA) and click the icon showing a funnel with a red X on it. Or, to quickly reset all filters to the default view, refresh/reload the page in your internet browser.
- Compare geographies: Index scores standardize key variables so that they can be meaningfully compared across locations. See these scores on the Gap Map and use the Location Comparison Tool to directly compare two geographies.
- Dashboard Variables: To see a list of all variables and their sources and definitions, click on the Framework & Variables tab.
What is a PUMA?
- PUMAs are Census statistical geographies containing no fewer than 100,000 people that allow for meaningful analysis and comparison. In areas where the population is less dense (more rural), PUMAs tend to cover one or more counties. In more densely populated areas (more urban), counties and cities are generally split into multiple PUMAs.
Technical Details
- ALICE Economic Viability Dashboard Variables: To see a list of all variables and their sources and definitions, click on the “Framework & Variables” tab.
- Below ALICE Threshold: Below ALICE Threshold variables are based on the U.S. Census Bureau Public Use Microdata Sample, which includes individual-level data. Individuals are mapped to households in the dataset, and this household-level data is used to determine ALICE Threshold status. If combined household income (for all members of the household) is less than the ALICE Threshold for their household size, composition, and location, that household and all members are below the ALICE Threshold. People and households below the ALICE Threshold include those that are below the Federal Poverty Level and those that are ALICE. Some variables in the dashboard are individual-level (including all work variables), and some are household-level (including all housing variables). Variable labels and descriptions include level of analysis, for ease of reference.
- Rounding: Percentages are rounded to whole numbers for ease of reading, which may result in percentages totaling 99% or 101%.
- Missing data: Any group with fewer than 100 individuals or households (depending on the variable) is suppressed (not shown) to maintain accuracy and confidentiality. For missing wages in the Work domain, there was insufficient source data to calculate a full-time wage.
- Race/ethnicity: All racial categories except Two or More Races are for one race alone, non-Hispanic. The Hispanic group may include individuals/households of any race.
- Index scores: Variables in the dashboard are composed of different kinds of measures. The first step is therefore to create a common scale across rates, percentages, and other scores by measuring from the average. Raw indicator scores are converted to “z-scores”, which measure how far any value falls from the mean of the set, measured in standard deviations. The formula for normalizing indicator scores is: z = (x – μ) / σ where x is the indicator’s value, μ is the national median, σ is the standard deviation for that indicator, and z is the resulting z-score. Scores are translated to a scale of 0 to 100, with 50 in the middle. Index scores have been created for the top Work variable (Full-Time Workers Earning Enough for Household Survival Budget (1 Adult, 1 School-age Child), the top Housing variable (the percentage of renter households below the ALICE Threshold paying less than 30% of income on rent), and all variables included in the Community composite score (see below).
- Community composite score: An average of the index scores created for each variable in this section, including the percentage of children age 3–4 in households below the ALICE Threshold who are enrolled in school; the percentage of households below the ALICE Threshold with high-speed internet access at home; the percentage of workers below the ALICE Threshold commuting 30 minutes or less to work; the percentage of adults below the ALICE Threshold (age 16–64) with health insurance; and the rate of grocery stores per 100,000 households below the ALICE Threshold.
- Geographic crosswalk: Some variables are only available at the county level. For these datasets, county totals are crosswalked and weighted into corresponding PUMAs using 2020 U.S. Census Bureau relationship files and number of households, first by crosswalking county totals to census tracts, then census tracts to PUMAs, with weighting based on the distribution of total households across each county.