|
Housingclick to view |

|
Health Careclick to view |

|
Child Care and Educationclick to view |

|
Technologyclick to view |

|
Foodclick to view |

|
Taxesclick to view |

|
Transportationclick to view |
||
Introduction
Food is the most basic of all needs. In a country with vast agricultural resources, it may seem surprising that any family faces hunger. Yet access to affordable, high-quality, healthy food continues to be a challenge for many. No community is immune to this problem; there are individuals in every county of the U.S. who intermittently or frequently do not have enough food to eat.
The Burden of Food Insecurity
The cost of moving from food insecurity to security provides insight into how thin the line is between financial hardship and stability. In 2016, the total shortfall for all U.S. families in meeting their basic needs was just over $21 billion, which, when spread across all food insecure Americans, was $41 per month per household, according to Feeding America.2 This budget shortfall means that families are forced to make difficult decisions, like choosing between food or paying for utilities or a needed prescription. And this burden extends beyond individual households: The U.S. spent an estimated $160 billion on health care costs related to hunger and food insecurity in 2014.3
A large number of households experience food insecurity. At some point during 2017, 12 percent of U.S. households were food insecure, including 16 percent of households with children.4 The prevalence of food insecurity varies by region and state, ranging from 13 percent in the South, to 10 percent in the Northeast; and from 7 percent in Hawai‘i to 18 percent in New Mexico.5
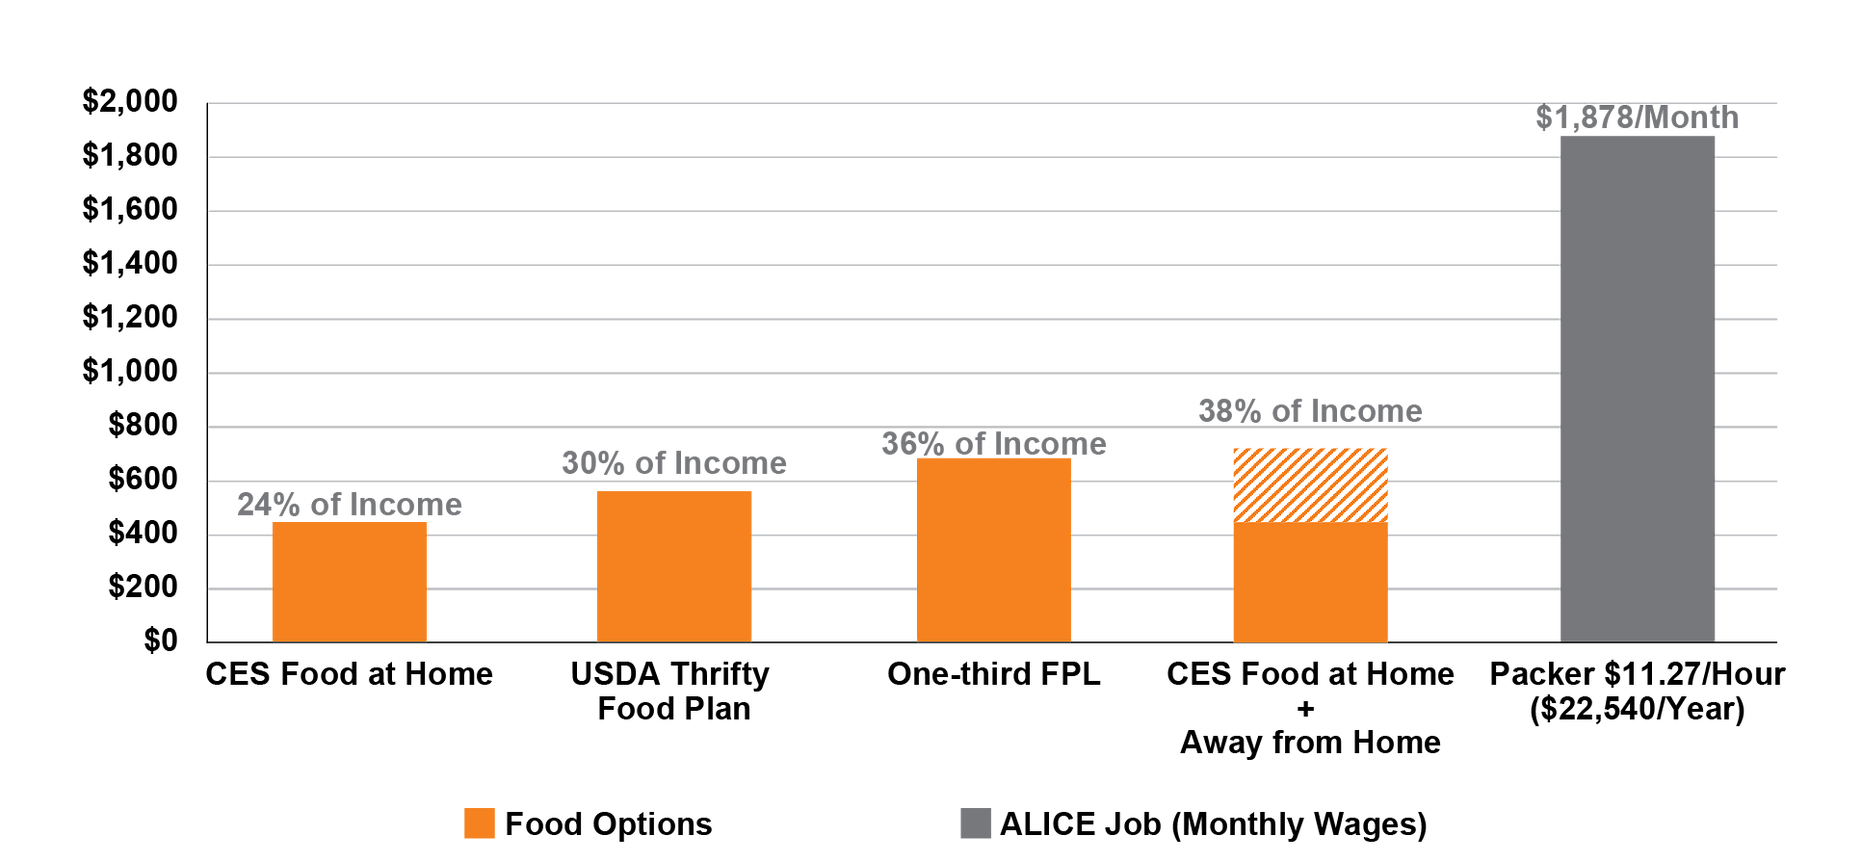
Having enough food is a basic challenge for ALICE and poverty-level households. The figure below shows the gap between how much ALICE families need for food and what they can afford to spend, comparing three different monthly food budgets for a family of four to the monthly salary of a full-time employee working as a packer.6 In the U.S., there were 693,170 packers, working at an average hourly wage of $11.27, or $22,540 annually (if full time, year-round) in 2017. Using the USDA’s most meager estimate, the Thrifty Food Plan, food for a family of four accounts for more than 30 percent of a packer’s salary. Using the original FPL, food costs the family one-third of a budget, which in this case is 36 percent of a packer’s income. And using the Consumer Expenditure Survey, which reflects actual spending, food costs 38 percent of an ALICE family’s expenses.7
Monthly Food Costs (Family of Four) with Percentage of an ALICE Income, 2017

Sources: Bureau of Labor Statistics. (2017). Table 3443: Consumer units of four people by income before taxes: Average annual expenditures and characteristics, Consumer Expenditure Survey, 2016–2017. U. S. Department of Labor; U.S. Department of Agriculture. (2017). Official USDA food plans: Cost of food at home at four levels, U.S. Average, July 2017; U.S. Department of Health and Human Services. (2017). 2017 poverty guidelines
Sources
1
Coleman-Jensen, A., Rabbitt, M. P., Gregory, C., & Singh, A. (2018). Household food security in the United States in 2017. Economic Research Report Number 256, United States Department of Agriculture (USDA). Retrieved from https://www.ers.usda.gov/publications/pub-details/?pubid=90022
2
Feeding America. (2019). Food insecurity in the United States. Retrieved from http://map.feedingamerica.org/
3
Cook, J. T., & Poblacion, A. P. (2016). Appendix 2: Estimating the health-related costs of food insecurity and hunger. 2016 Hunger Report. Retrieved from http://hungerreport.org/2016/wp-content/uploads/2015/11/cost_of_hunger_study.pdf
4
U.S. Department of Agriculture (USDA). (2017). Food security status of U.S. households in 2017. Retrieved from https://www.ers.usda.gov/topics/food-nutrition-assistance/food-security-in-the-us/key-statistics-graphics.aspx#foodsecure
5
Coleman-Jensen, A., Rabbitt, M. P., Gregory, C., & Singh, A. (2018). Household food security in the United States in 2017. Economic Research Report Number 256, United States Department of Agriculture (USDA). Retrieved from https://www.ers.usda.gov/publications/pub-details/?pubid=90022
6
Bureau of Labor Statistics (BLS). (2017). Occupational employment statistics. Retrieved from https://www.bls.gov/oes/current/oes_nat.htm#41-0000
U.S. Department of Agriculture (USDA). (2017). Official USDA food plans: Cost of food at home at four levels, U.S. average, May 2017. Retrieved from https://fns-prod.azureedge.net/sites/default/files/CostofFoodMay2017_0.pdf
U.S. Department of Health and Human Services. (2017). 2017 poverty guidelines. Retrieved from https://aspe.hhs.gov/2017-poverty-guidelines
Bureau of Labor Statistics (BLS). Consumer expenditure survey, Table 1502: Composition of consumer unit: Annual expenditure means, shares, standard errors, and coefficients of variation, Consumer Expenditure Survey, 2017. Retrieved from https://www.bls.gov/cex/2017/combined/cucomp.pdf
7
Bureau of Labor Statistics (BLS). (2017). Occupational employment statistics. Retrieved from https://www.bls.gov/oes/current/oes_nat.htm#41-0000

