The State of ALICE in ILLINOIS

Dig Deeper with ALICE Data Tools
Learn More: Hear From ALICE
Hear directly from ALICE or share your own ALICE story on the ALICE Voices page
ALICE Data and Indicators of Well-Being
Having a low income is often associated with lower levels of education, higher rates of unemployment, and poorer health. Communities that have been able to disrupt these associations can provide important insights into how to change environments or policies to support ALICE households. Tracking relationships between ALICE households and other variables at state and county levels can also help stakeholders ask important questions and target resources where they can have the greatest impact.
Learn More
To learn more about adding additional indicators, contact info@UnitedForALICE.org
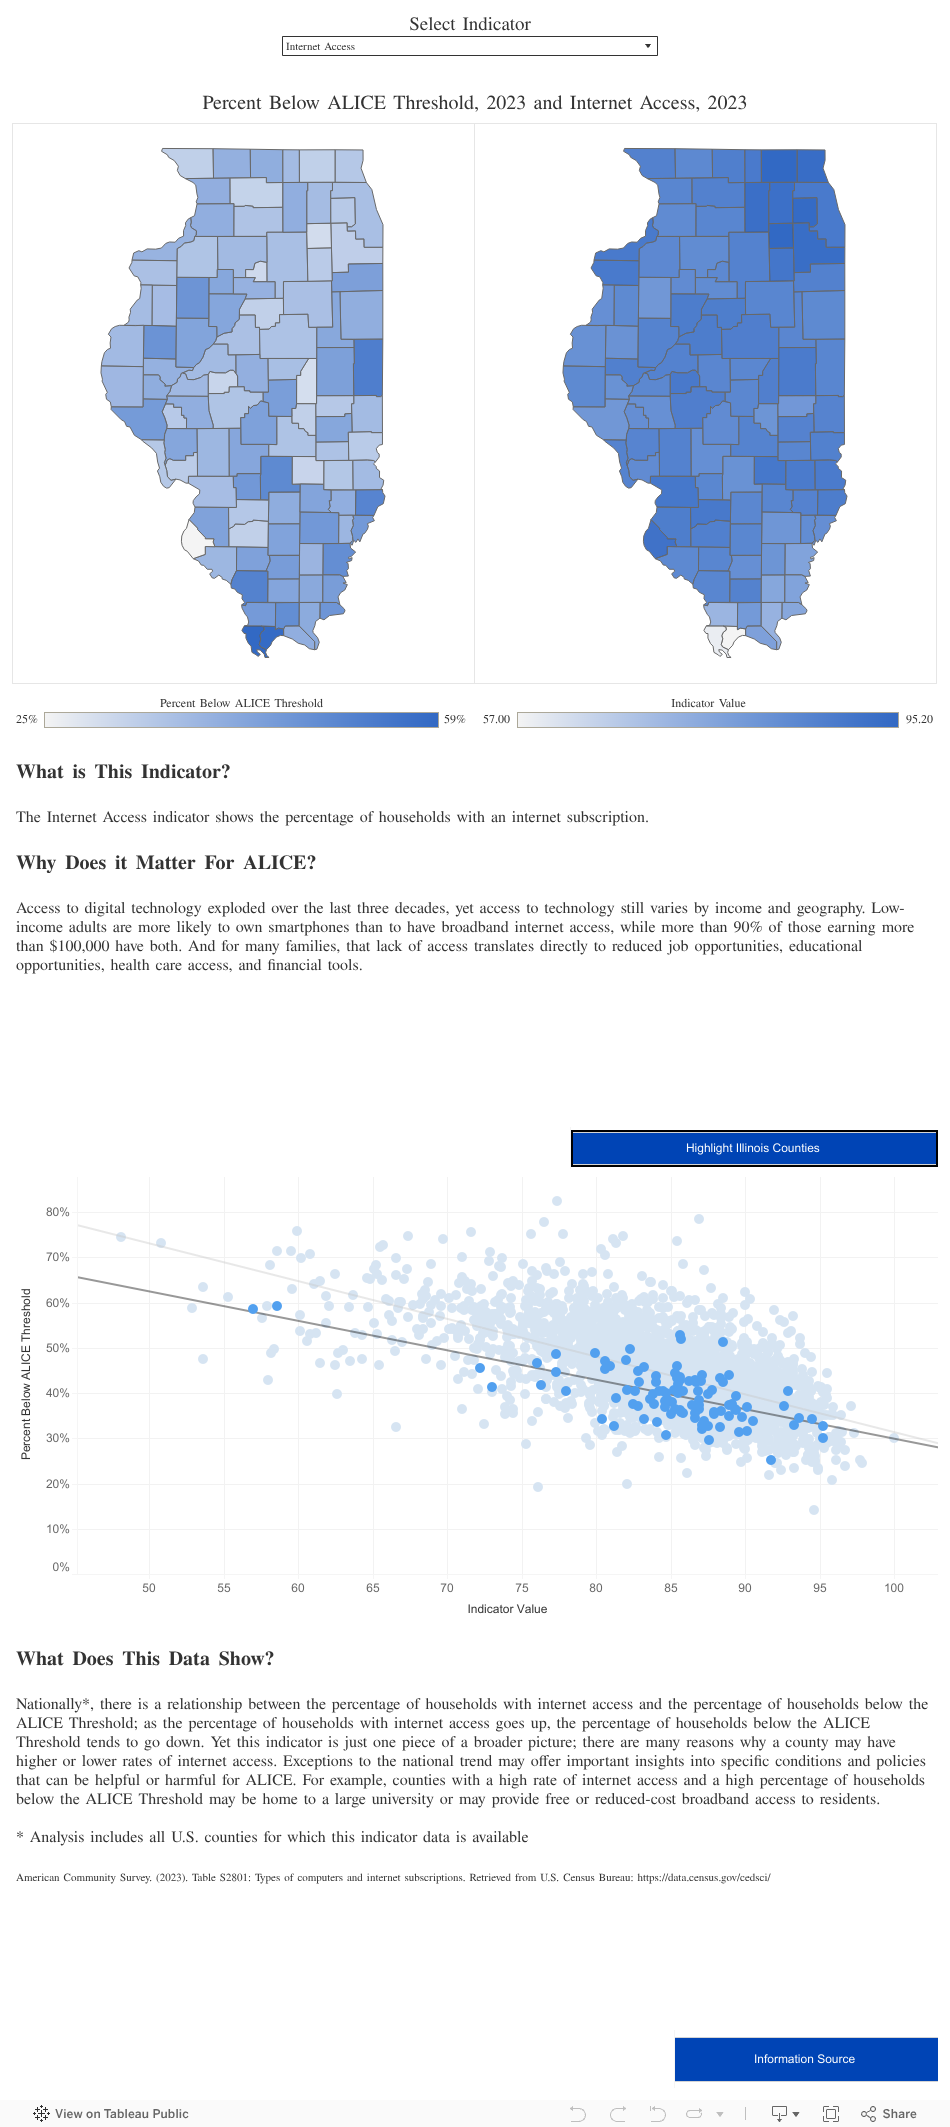
The maps below show the percentage of households below the ALICE Threshold (poverty + ALICE) — households that cannot afford the basics in the communities where they live — along with additional indicators of well-being.