
National Overview
We all know ALICE — Asset Limited, Income Constrained, Employed — households that earn more than the Federal Poverty Level, but not enough to afford the basics where they live. ALICE households and households in poverty are forced to make tough choices, such as deciding between quality child care or paying the rent — choices that have long-term consequences not only for their families, but for all.
United For ALICE calculates the cost of household essentials for all counties in the U.S. These costs, outlined in the Household Survival Budget, are calculated for various household sizes and compositions.
Of the 132,530,794 households in the U.S. in 2023…
- 13% earned below the Federal Poverty Level (FPL)
- 29% were ALICE, in households that earned above the FPL but not enough to afford the basics in the communities where they live
- Together, 42% of households in the U.S. were below the ALICE Threshold (poverty + ALICE divided by total households)
While the COVID-19 pandemic brought employment shifts, health struggles, and school/business closures, it also spurred temporary expansion of public assistance through pandemic relief measures (which then reverted to pre-pandemic levels in 2022). Before the pandemic, in 2019, 50,412,382 households were below the ALICE Threshold; by 2023 that number had changed to 55,516,668.
State-Level Details, 2023
This interactive map provides four data points for each state and county:
- Total number of households
- Percentage of households in poverty
- Percentage of ALICE households
- Percentage of households above the ALICE Threshold
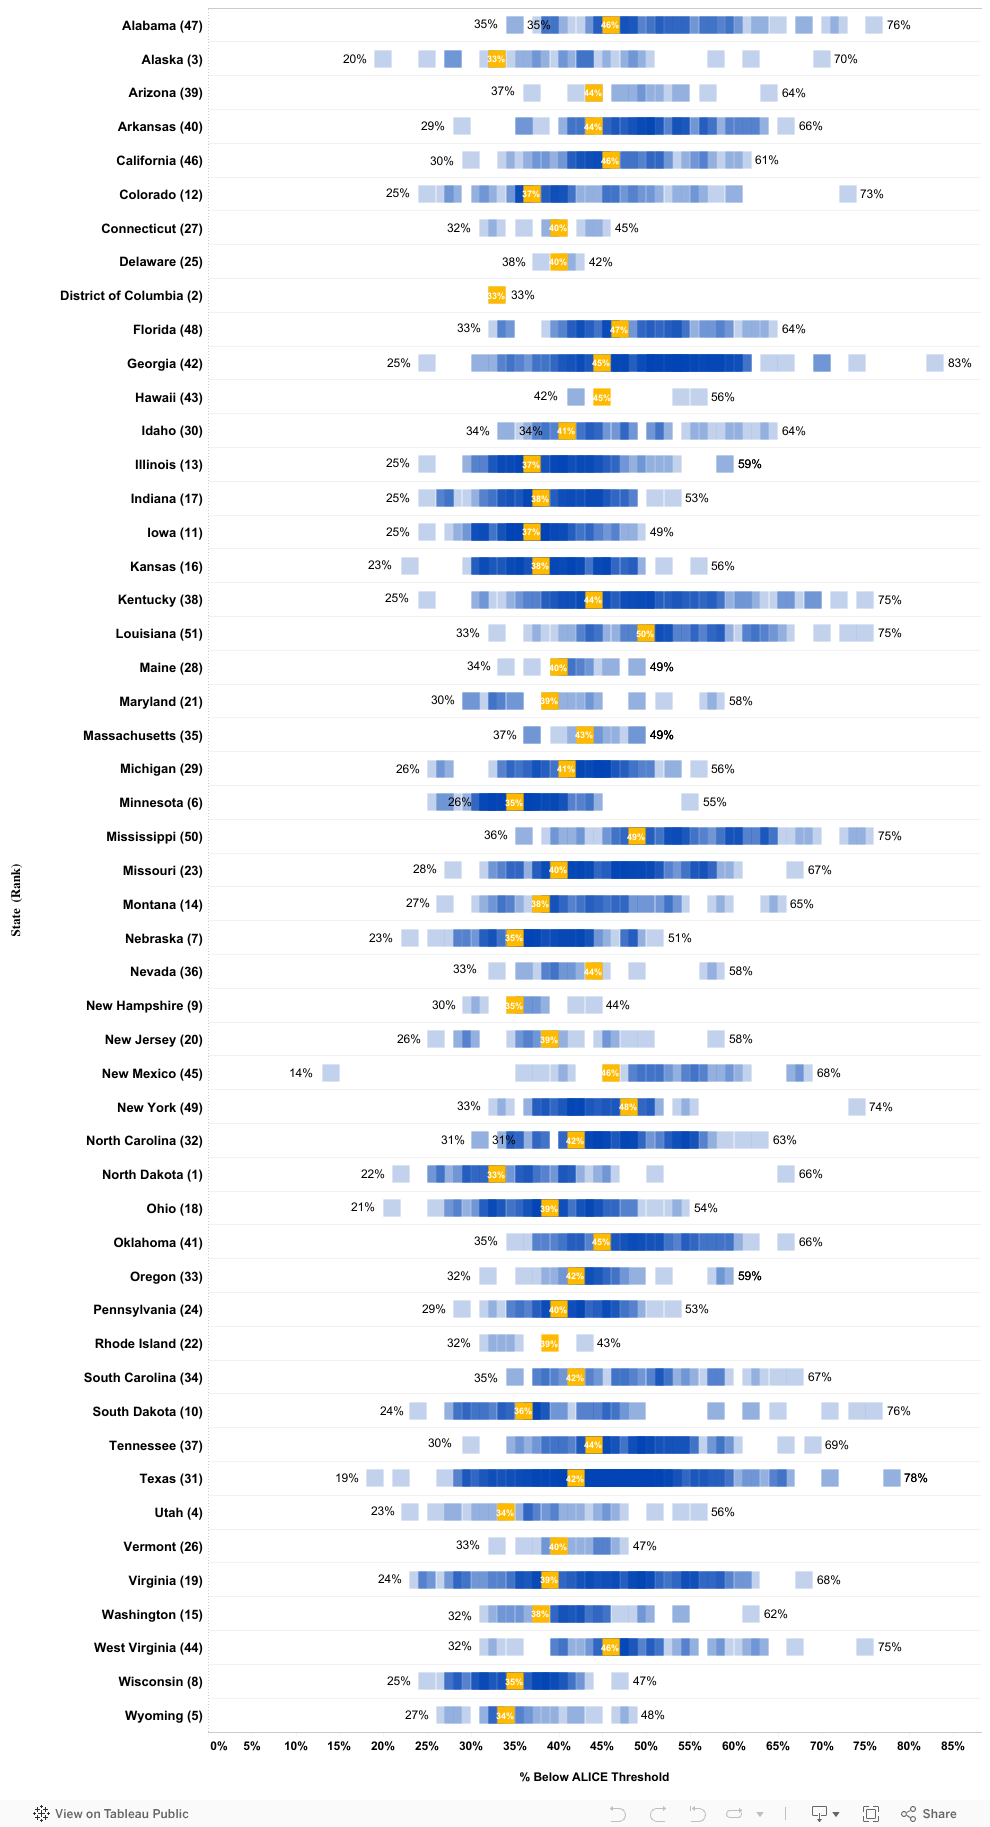
National Comparison, 2023
This interactive figure compares the percentage of households that live below the ALICE Threshold in each state in 2023. State averages are shown in gold. The percentage of the population that is below the ALICE Threshold within each county is represented by the blue boxes. This visual shows the variation in financial hardship that exists across and within states.
National Demographics, 2023
This interactive figure shows the demographic breakdown of poverty-level, ALICE, and above ALICE Threshold households in 2023 at the national level. Data shown below include households by age, household type, race/ethnicity, and rural/urban area.
