
Research Center
ALICE In Focus Series
Financial Hardship Among People With Disabilities
Longstanding discriminatory policies and practices that impact access to education, employment, health care, housing and other resources create barriers to financial stability for people with disabilities. This fact hits home for the more than 40 million people in the U.S. who have a cognitive, hearing, vision, or ambulatory disability, or one that makes self-care or independent living difficult.
According to the outdated Federal Poverty Level, 18% of people with disabilities in the U.S. lived in poverty in 2019. Yet United For ALICE data shows that another 34% were also struggling, in households that earned above the FPL but less than what it costs to afford the basics. These households are ALICE: Asset Limited, Income Constrained, Employed.
Between families in poverty and those who are ALICE, more than half of all people with disabilities in the U.S. lived in a household with income below the ALICE Threshold, struggling to afford essentials in the communities where they lived.
The tabs below offer a more detailed view of people with disabilities who are experiencing financial hardship.

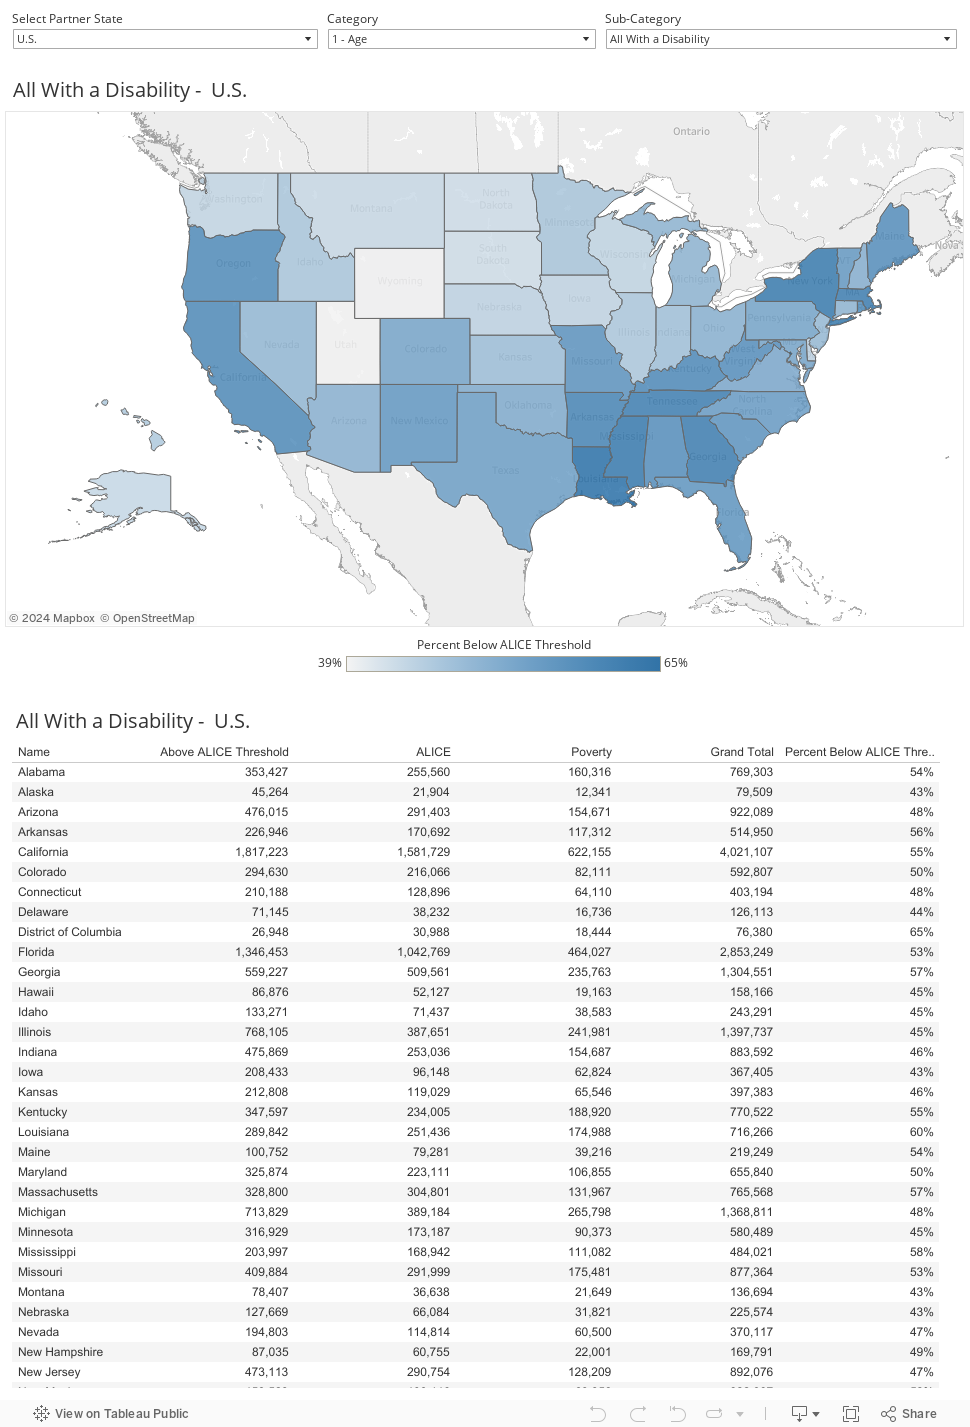
Local Maps
While there are people with disabilities in every community across the U.S., their demographics, household characteristics, and access to resources vary by location. The interactive map on this page shows the percentage of people with disabilities below the ALICE Threshold in ALICE partner states by Public Use Microdata Areas (PUMAs) — a U.S. Census Bureau geography made up of groupings of about 100,000 people.
How to Use This Tool
- Select an ALICE Partner State or select 'U.S.' to see national data
- Select both a Category (like Age) and Sub-Category (like 5–17 Years). When a new category is first selected, the map will disappear until a new sub-category is selected.
- View the table below the map to see the number of people with disabilities in each group by location
Technical Details
- Sources: ALICE Threshold, 2019; U.S. Census Bureau, American Community Survey, PUMS, 2019 (latest available as of publication date).
- Rounding: Percentages in the ALICE Disability Data Dashboard may differ +/- 1% from percentages included in the state and national Research Briefs due to rounding. Total numbers are presented in the Dashboard for calculation.
- Race/Ethnicity: All racial categories except Two or More Races are for one race alone, non-Hispanic. The Hispanic group may include households of any race.
- Sex: Sex includes the sex reported by the respondent for household members; the ACS only includes the options “male” or “female”.
- Work Status: The Work category includes only people ages 18–64.
- Selected Variables: All variables in this Dashboard come from the American Community Survey. To see how these variables are defined and named in this Dashboard, download the DATA DICTIONARY
- Missing Data and Grand Totals:Any group with fewer than 200 people with disabilities is suppressed (not shown) to maintain accuracy and confidentiality. Grand totals exclude any sub-populations that are too small to display (sums in columns).